Power BI concept is based on the following ideas:
 |
 |
|
 |
|
|
1. Colorful modern graphics Modern technologies with regard to the latest trends in data analysis. |
|
2. Self-BI Business users can analyze and create interactive panels themselves without the help of an IT-department. |
|
3. Mobility Applications for mobile devices on Windows, Android и iOS. |
|
|
|
|||
 |
|
 |
|
 |
|
4. Everything at once! Analyze all your data at the same time in a convenient format. Built-in connectors to the majority of systems and services. |
|
5. Data representation Large set of visual representation options. |
|
6. Speaking your language Just ask power BI: “What is the profit of all the projects of the 2nd quarter of 2016?”, and the system will give you an immediate answer by showing you an interactive panel. |
|
|
|
|
|
|
 |
|
 |
|
|
|
7. Single analytical center You don’t need to look for the information on the current situation in the company in different files and folders. All the analytics is formed in a SINGLE interactive interface. |
|
8. Shared access Shared access to all the applications from any devices. |
|
|
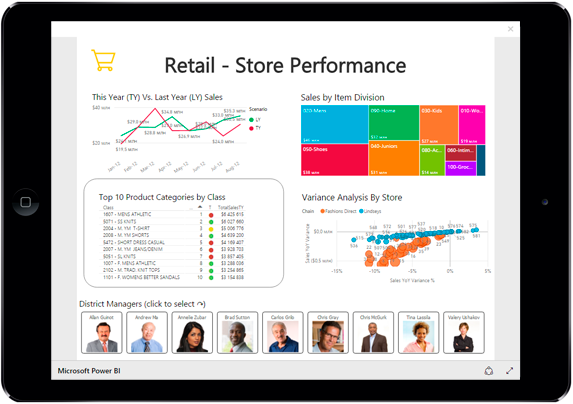
Interactive (clickable) demo
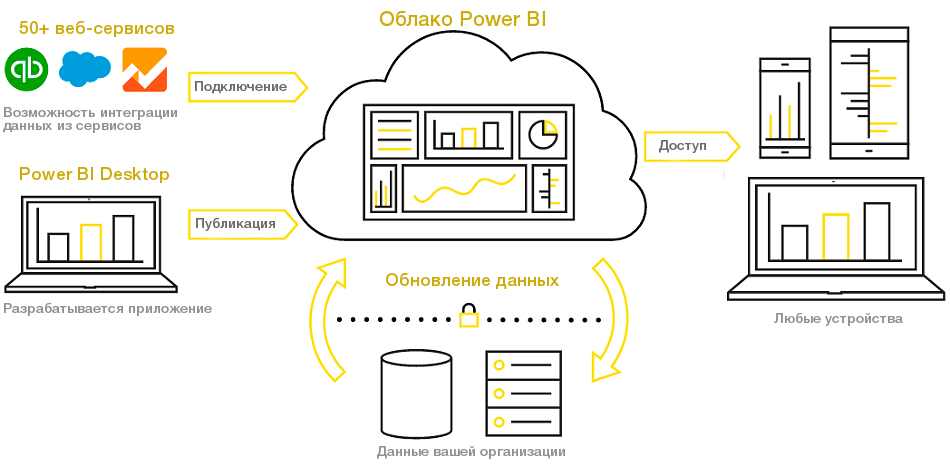
Power BI Architecture
Power BI’s functionality
Key features
Features
Power BI
Power BI Pro
The limitation of data capacity
1 GB per user
10 GB per user
Create, examine and use personal monitoring panels and reports together with other Power BI users
Create content with the help of Power BI Desktop
Look through data using the natural language
Get access to informational panels on mobile devices, using the native applications for iOS, Windows and Android
Use verified data packages for such services as Dynamics, Salesforce and Google Analytics
Import data and reports from Excel, CSV and Power BI Desktop
Internet publications
| Features | Power BI | Power BI Pro |
|---|---|---|
| The limitation of data capacity | 1 GB per user | 10 GB per user |
| Create, examine and use personal monitoring panels and reports together with other Power BI users | ||
| Create content with the help of Power BI Desktop | ||
| Look through data using the natural language | ||
| Get access to informational panels on mobile devices, using the native applications for iOS, Windows and Android | ||
| Use verified data packages for such services as Dynamics, Salesforce and Google Analytics | ||
| Import data and reports from Excel, CSV and Power BI Desktop | ||
| Internet publications |
Data updating
Features
Power BI
Power BI Pro
Use content with pre-planned updates
Everyday
Every hour
Use streaming data on the informational panels and reports
10,000 lines per hour
1 million lines per hour
Use dynamic data sources with full interactive abilities
Get access to local data with data connection getaways (personal and for data management)
| Features | Power BI | Power BI Pro |
|---|---|---|
| Use content with pre-planned updates | Everyday | Every hour |
| Use streaming data on the informational panels and reports | 10,000 lines per hour | 1 million lines per hour |
| Use dynamic data sources with full interactive abilities | ||
| Get access to local data with data connection getaways (personal and for data management) |
Shared access
Features
Power BI
Power BI Pro
Work together with your team, using Office 365 groups in Power BI
Create, publish and examine data packages of the organization
Manage access and shared work with the help of Active Directory groups
Shared data requests through data catalogue
Control data access with the help of security tools on the level of the lines for users and groups
| Features | Power BI | Power BI Pro |
|---|---|---|
| Work together with your team, using Office 365 groups in Power BI | ||
| Create, publish and examine data packages of the organization | ||
| Manage access and shared work with the help of Active Directory groups | ||
| Shared data requests through data catalogue | ||
| Control data access with the help of security tools on the level of the lines for users and groups |
Why do you need Power BI?
With Power BI you will be able to analyze all your company’s data, both cloud and local. Using your imagination and Power BI visual instruments you will create interactive reports in a matter of seconds in real-time regime. The system will automatically eliminate problems with data formatting. While working with BI you will be able to connect up the SQL Server data bases, Analysis Services models and other data sources to the same interactive panels in Power BI.

What do you have to know to work with Power BI?
After the implementation of the system, a business-user doesn’t need any special knowledge to successfully work with the data. Convenient, intuitive interface will allow you to quickly and easily change or create analytics in the necessary representation.
Power BI Implementation project
First Bit’s BI Team is a team of the industry’s experts with a solid experience of project implementation on different platforms. We cover all the client’s needs in a complex within the implementation of a business intelligence Power BI system:
- Survey of your business processes
- Formation and coordination of requirements to a BI system
- Connection to the data sources and their consolidation
- Building a data model and reports development
- User training for your employees (business-analysts and developers)
- Professional technological support of your company in the future
Examples of Power BI solutions
Sales, retail, wholesale
|
|
|
Manufacturing
|
|
|
Marketing analysis
|
|
|
Analysis of the insurance company’s activities
|
|
|
Financial analysis
|
|
|